I’ve had a lot of luck using this article to push performance conversations further. The numbers are dated but the concepts are real.
You have to know how good is good enough. How bad is too bad to tolerate. You have to separate user interactions by value and user expectations. Here I break down user expectations and give some (lenient) standards that ought to be worth discussing (and keep people from setting their hair on fire).
Web Sites Don’t Get Special Dispensation
The guidelines for latency limits are not new. For example, the advice given in Response Times: 3 Important Limits is over 40 years old, but still generally true. In fact, special guidance to web-site operators only tends to emphasize how more and more impatient our users are becoming. Consider these excerpts from a white paper by Gomez entitled Why Web Performance Matters: Is Your Site Driving Customers Away:
The average online shopper expects your pages to load in two seconds or less, down from four seconds in 2006; after three seconds, up to 40% will abandon your site.
Gomez’ own studies reveal [a] lack of visitor loyalty. By analyzing page abandonment data across more than 150 websites and 150 million page views, Gomez found that an increase in page response time from 2 to 10 seconds increased page abandonment rates by 38%.
[The] average impact of a 1-second delay meant a 7% reduction in conversions.
(original emphasis.)
The industry advice continues on and on: incremental decay in performance causes decay in retention and conversion. Slowing down matters. A lot.
Shades of Success and Failure
We often boil this all down to “How long is too long?” We want a line in the sand. The problem with that is it doesn’t express the continuum of bad consequences that arise from bad performance. There isn’t a magic upper limit to response times. We can’t naively say, “As long as the response time is better than X we’re OK, but once it crosses X there’s a crisis.”
There is certainly a lower limit on how fast something operates: getting an operation to return in 500 microseconds instead of 2 milliseconds isn’t going to pay dividends if the observer is a human. We just can’t tell the difference.
Instead of asking how long is too long, start with how fast is fast enough. This helps us limit our investment in things that are already doing well enough. Remember, this is only applicable to human interaction. When something is “fast enough” it gets an “A”. At that point, the return on investment falls off — sometimes dramatically.
The upper limit of latency — the demarcation of total failure — is harder to quantify and certainly less static. The lower bound on latency is caused by physiological limitations in the human body. The upper bound is subject to the changing expectations of ever refining tastes.
With this in mind it should be clear that a set of criteria for judging grades of success will be subject to change. However, that doesn’t stop us from making our current, best guess.
|
Grade |
Motto |
Notes |
|
A |
Leave it Alone |
From a human factors perspective, it is wasteful to make it faster than this. You’re stealing from other features that need remediation or creation. |
|
B |
Acceptable |
Users will generally be pleased by this. A margin (up to 10%) of the snobbiest (most discerning) users will still be dissatisfied. |
|
C |
Tolerably Slow |
Users will generally dislike this, but tolerate it. Up to 20% of your users may fail to convert or continue the flow simply because of performance. Snobby (highly discerning) users will declare this a total failure. |
|
D |
Dangerously Slow |
Majority of users will deem this unacceptable relative to their other web experiences. |
|
F |
Automatic Ship-Stopper |
Unusable for all but the most intensely motivated users. |
User Expectations Vary Across Categories of Interaction
Again, there is no clear line between success and failure. To make matters worse not all operations have to meet the same standards. Users allow some operations to take longer than others based on many complex factors. Let’s boil these down to four categories of interaction, represented in the following table. We name each category, give an example of an interaction falling roughly into that category, and a typical black-and-white limit for that category based on articles like those mentioned above.
|
Category |
Example |
Typical Limit |
Impression of the Interaction |
Notes |
|
Point |
Stimulus: click on a check-box Response: check mark appears |
100 ms |
What interaction? The computer is invisible. |
The user does not tolerate a perceptible delay. The expectations on these interactions are so high that a round trip to the server is (generally) out of the question. |
|
Chunk |
Stimulus: click on a drop-down that lazy loads it’s content. Response: after a brief delay, the content appears in a relatively small portion of the screen |
1.0 s |
The computer is working for me. I’m in the flow. |
Ajax interactions that change a small portion of the page generally fall in this category. |
|
Page |
Stimulus: click on a search result Response: a new article appears taking up most or all of the screen |
3.0 s |
Hmm.. That took a moment. I will allow it. |
When the whole screen gets redrawn. We play games with user perception by getting something to render without waiting for everything. Be careful, if the user is actually waiting for something that is last to render then these games fail to improve perception. |
|
Commit |
Stimulus: click “Commit” at the end of a wizard. Response: see prompt that the work is done and ready to be inspected |
10 s |
Wow, that was a lot of work. Good thing that doesn’t happen every day. |
This is the upper limit on how much waiting a user is willing to do in-flow. You can’t have many pages like this. You really shouldn’t even show a spinner. The user should get concrete feedback on progress. |
|
Batch |
Stimulus: place a stamped envelope in the mail-box on the curb. Response: read the snail-mail reply |
> 10 s |
Huh? Oh yeah! I remember doing that, but my context needs to be totally rebuilt. |
Anything taking longer than about 10 seconds ought to yield the context to the user and communicate completion some other way. Don’t hold the user staring at a spinner for 30 seconds. Too long! |
Slower Interactions Must Be Less Frequent Than Faster Interactions
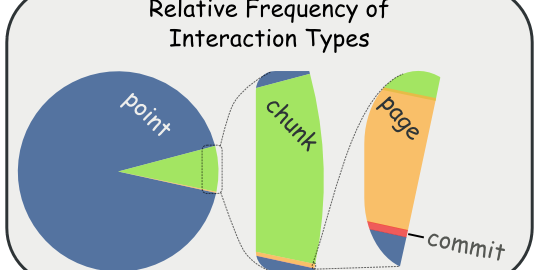
Slower interactions (like lazy-loading a product’s information) should happen much less often than faster operations (like responding to a user click to draw a check-mark). The following graphic gives a qualitative feel for what this means:
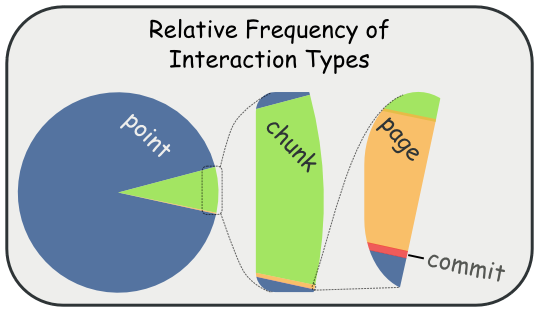
This image roughly says that Page interactions ought to occur much more often (meaning, at least an order of magnitude more often) than Commit interactions. Chunk interactions are much more frequent than Page. Finally, Point interactions are much, much more frequent than Chunk.
Keep this in mind when trying to decide what latency category an interaction belongs to.
Will the user do this rarely (less than daily)? Will they do it regularly (roughly every session)?
Mean Stinks at Performance Requirements — We Use 95th Percentile
If you suppose that 2 seconds is the acceptable latency for an operation, and testing reveals that the operation is returning in 1.8 seconds, on average, then have you succeeded? Probably not. Unless all instances of that operation complete in roughly the same amount of time there is a good chance that about 25% of your users are having an unacceptable experience.
We don’t use average, we use 95th percentile. That allows for a tail of exceptional cases (which still matter but aren’t our focus) while giving a more correct impression about how fast the system is for all of your users.
Total User Experience Category Grades Measure End-To-End Latency
We’re going to throw out Point and Batch interactions. Point interactions are so fast that we don’t expect a back-end call to be involved. Batch interactions are so long that we don’t expect their naked latency to be exposed to the user. That is, we expect such a long operation wouldn’t block the user from progressing by throwing up a spinner for several minutes.
Here are the guidelines for grading Chunk, Page, and Commit interactions. All numbers are in seconds, and according to the 95th percentile of the measurement.
|
|
A+ |
A |
A- |
B+ |
B |
B- |
C+ |
C |
C- |
D+ |
D |
D- |
F |
|
Chunk |
0.27 |
0.37 |
0.50 |
0.75 |
1 |
1.4 |
2 |
2.7 |
3.7 |
5.5 |
7.4 |
10 |
>10 |
|
Page |
0.82 |
1.10 |
1.5 |
2.2 |
3 |
4.0 |
6 |
8.2 |
11 |
16 |
22 |
30 |
>30 |
|
Commit |
2.7 |
3.7 |
5 |
7.4 |
10 |
14 |
20 |
27 |
37 |
55 |
74 |
100 |
>100 |
Notice that each series progresses exponentially with a “B” being roughly OK. We realize that this might lead to some easy to lampoon results. For example, what makes a 3.7 second response time a C- and a 20 an F? Sounds a bit like magic numbers. Still, we believe there is value in having a constant relationship between the grades. For example, it is useful to know that a B is exponentially worse than an A, and a C is exponentially worse than a B. Furthermore, performance improvements tend to become exponentially more difficult to achieve. So, improving from a D to a C is about as hard as improving from a B to an A. (If the progression were linear then it would be much easier to go from D to C.)
Don’t Game Your Category
WARNING: A team may rationalize that a particular measurement is scoring so poorly because it has been miscategorized. For example, you say, “We can frabinaz in 3 seconds, which is a C for Chunk interactions; but, let’s just call it a page interaction and then we will have a B.” That works as long as the user experience is designed with that in mind. Calling something a “page” interaction means that we expect users to do it at least an order of magnitude less often than a “chunk” interaction, and we assume their expectations will be relaxed and forgiving. You can game the system with categories, but calling everything a Commit doesn’t achieve patron retention and conversion.
Assume Mobile (3G Budget)
If you have to simulate bandwidth then start with mobile bandwidth. Most general purpose sites can’t afford to ignore the mobile experience.
Keep Back-End Performance on a Tight Budget
Sometimes back-end operations need to be implemented without a UI to surface them. You should still keep them on a tight budget. And it isn’t fair for the back-end to spend all of the performance budget.
According to High Performance Web-Sites, back-end time for most Yahoo properties accounts for 10 to 20 percent of the total latency. Based on that, we budget 20 percent of total Page latency for back-end.
Since Chunk interactions should have far fewer assets, we double the back-end’s relative allotment of time to 40 percent.
Commit interactions should be dominated by the back-end latency of the interaction. They get a relative allotment of 80 percent.
|
|
Back-End Budget of Total Latency |
|
Chunk |
40% |
|
Page |
20% |
|
Commit |
80% |
That makes this the Back-end Grade Scale for Chunk, Page, and Commit interactions.
|
|
A+ |
A |
A- |
B+ |
B |
B- |
C+ |
C |
C- |
D+ |
D |
D- |
F |
|
Chunk |
0.11 |
0.15 |
0.2 |
0.3 |
0.4 |
0.56 |
0.8 |
1.08 |
1.48 |
2.2 |
3 |
4 |
>4 |
|
Page |
0.16 |
0.22 |
0.3 |
0.45 |
0.6 |
0.84 |
1.2 |
1.6 |
2.2 |
3.3 |
4.4 |
6 |
>6 |
|
Commit |
2.16 |
2.96 |
4 |
5.92 |
8 |
11.2 |
16 |
21.6 |
29.6 |
44 |
59.2 |
80 |
>80 |
Common Language Helps
In many ways, the categorization and cut-offs are arbitrary. It’s just a model to provide common language for discussing performance.
Make sure your back-end folks know the experience their call will be part of. Tell them if it is a chunk or a page.
Make sure you identify your A interactions. For those critical parts of your experience you should probably target an A, even if some less important part of the site is at a C.
Make your own trade-offs. Those are yours. This is just language for discussing them.